Introduction

Gitlab is a powerful tool for software development, but is not natively designed for charts; this limit is circumventable by using external plugins or by following the solution which I'm going to describe here. To achieve this target, it's possible to exploit G sheet functionalities, its internal scripting tool, and Gitlab's API. I've used this logic to build QA/QC KPI charts that automatically updated, by getting some data like the number of bugs per sprint, bug severity for each sprint etc... Once you get the data in Gsheet, you can post-process whatever you want, like build and embed charts.
API Overview
Let's provide a quick introduction regarding what an API is. The APIs (Application Programming Interfaces), are software-to-software interfaces which allow different applications to exchange information or functionalities. An API call is a process where a client application submits a request to the API made available by the Server; the data request performed is sent back to the client. The Server exposes its API using an address called URI (Uniform Resource Identifier), defined as the unique sequence of characters that identifies a logical or physical resource used by web technologies. Once you have the URI, then you can formulate the request through a "verb", a command string that distinguishes a specific action you want to do with the invoked data on the server. The four most basic request verbs are:
- GET: To retrieve a resource;
- POST: To create a new resource;
- PUT: To edit or update an existing resource;
- DELETE: To delete a resource.
So, for our purpose, we are going to use: Google Sheets with App script as our Client, through which we will use the GET verb only, as long as we want just to get data to nourish our charts; Gitlab is the Server, that exposes its API through specific URIs endpoints, like:
- https://gitlab.com/api/v4/projects/ - You need the Project ID
- https://gitlab.com/api/v4/groups/ - You need the group ID
Gitlab's API
Gitlab's API is a service that is reachable and usable only if the authorization server approves the client's request (Git credential manager), which contains the security credentials for a login session and identifies the user, the user's groups, and the user's privileges. Among the various options, getting a Personal access token could be the easiest way to integrate it into our API Calls. Through the Gitlab user’s setting panel and Preferences section, is possible to generate the access token:
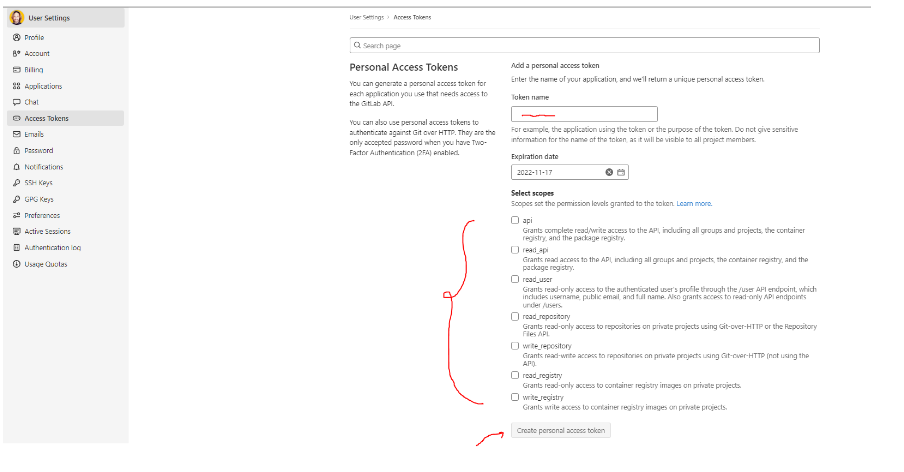
The generated encrypted string is the TOKEN KEY must be inserted directly into the script, which will work as a bypass from the client and server, to get back the requested data.
Write your API Calls
Thanks to the Gitlab API Resources it's easy to understand the query's syntax acknowledged by the server.
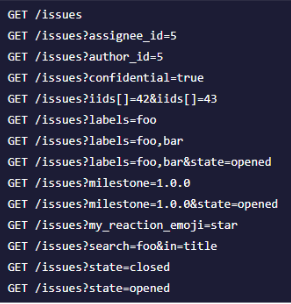
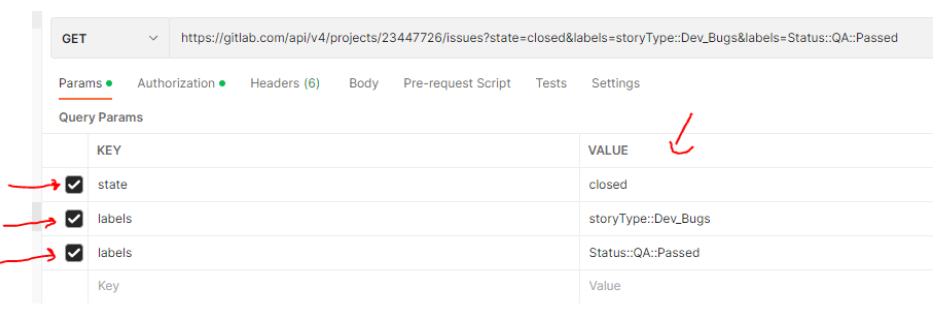
For instance, in the above screenshot, you can see the GET calls at the "Project" level, relating to the "issues" We can easily perform some API Calls Tests by using Postman. Postman allows having your own, multiple workspaces, which includes the possibility to create groups of API calls. Here is an example below:
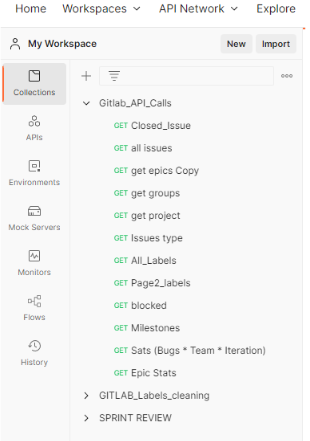
Before creating the first API call, we need to add the TOKEN KEY (as explained in the previous paragraph); once you've generated the token key in Gitlab, you can add it as a "Bearer Token" in the "Authorization" Panel of Postman.

Now we are ready to send an API Call, let's try to get all the issues in the closed state. If everything is properly set, Postman will return the result in the bottom part of the UI.
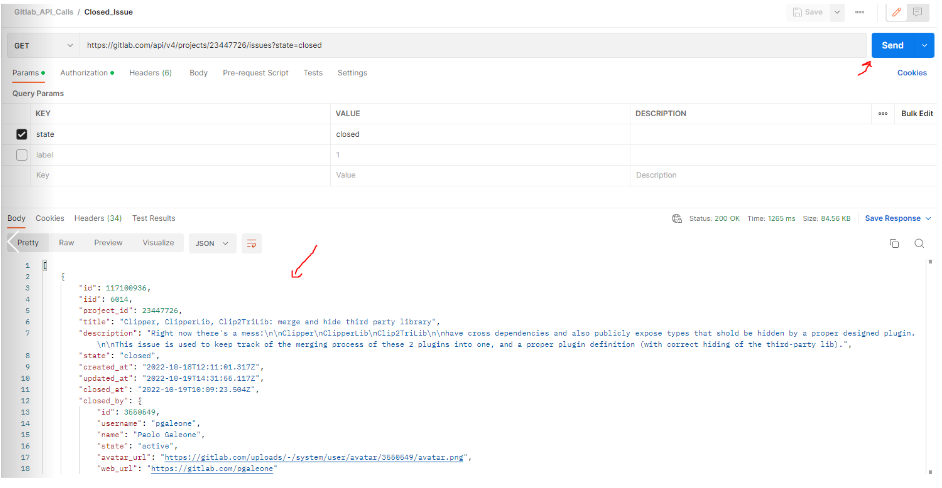
Over the inline way, when the queries include parameters, Postman recognizes them as "KEY", and it allows customization through the "VALUE" column. The Parameters can be untangled, and the inline query gets automatically updated accordingly.
For the main target of this tutorial, it came to me essential, to the Issue statistics API:
This call returns the sum data aggregation of the desired query, and in particular:
- All issues (based on the query)
- Open issues (based on the query)
- Closed issues (based on the query)
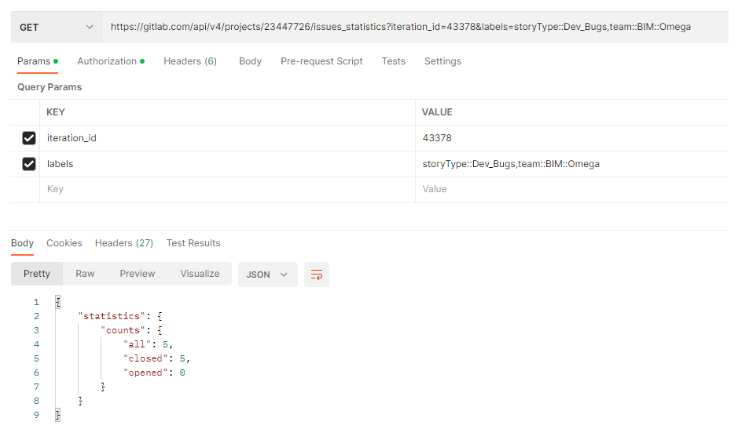
For instance, the API Call below aims to get all the issues of a specific iteration:
the parameter is “iteration_id” and “43378” identifies a unique iteration A specific issue’s type is owned by a specific team: the parameter is “labels” and the values are set in “and” condition. The result of the query is 5 issues of closed ones.
Gogle App Script as Client for the API Calls
Regarding Google Apps Script Environment, I suggest looking for the overview already explained in this post: Daily Builds: Send Discord/Gmail Notifications via GSheet.
Here below the function (the query aims to get the solved bugs marked as critical):

Where:
- Var url = “The API URL”
- Authorization= “Token key generated in Gitlab”
- getSheetByName (“the sheet name where you want to get the data)
- sheet.getRange (row, column) where you can download the data
By executing the function (manually or with an automatic trigger), the successful API Call allows you to retrieve the invoked data in the defined sheet cell.
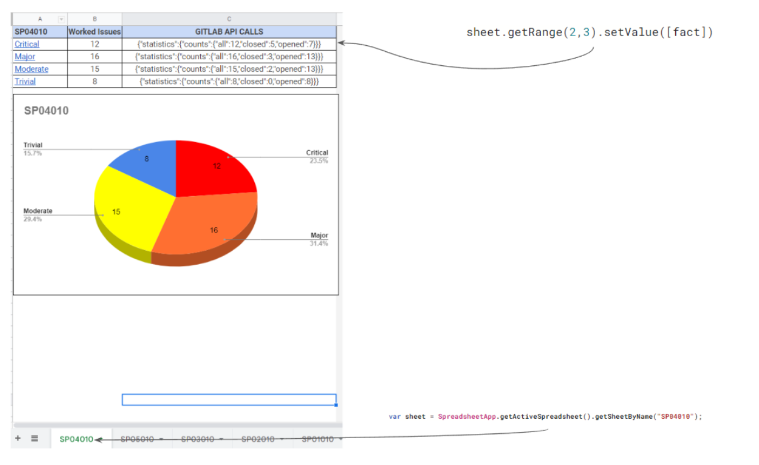
I’ve replicated the script for other queries (Critical, Major, Moderate and Trivial Bugs for each sprint) and through the Gsheet functions, I got only the numbers I need to nourish the chart: I’ve chosen the pie-one in this case.
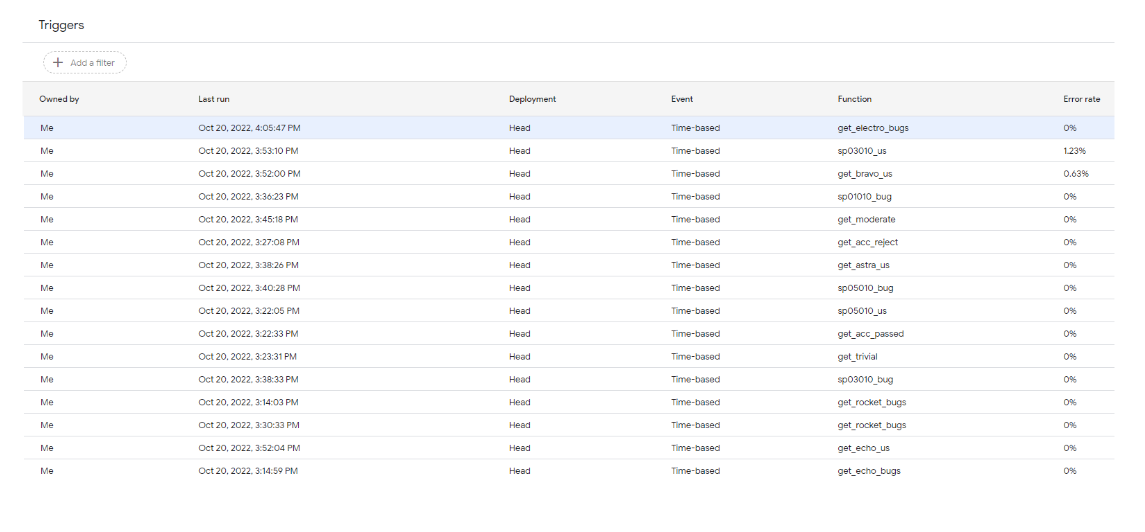
The last step is to schedule each function as an hourly trigger, to refresh automatically the data called by the API. In the screen below you can see the list of the Time-based triggers linked to each function that invoked the different API URLs.
Google Website and Slides Integration
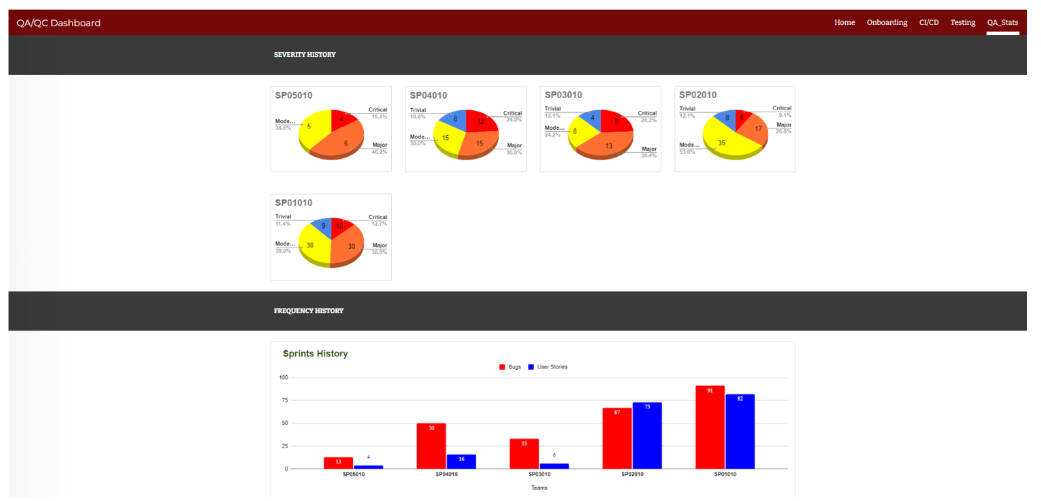
To make the consultation of the charts more attractive and professional compared to a Simple Google Sheet, it is very easy to embed them into a Google Site. Google Site is part of the Gsuite, and it's integrated with all the other apps; here below is the result of the embedding in the QA Board webpage:
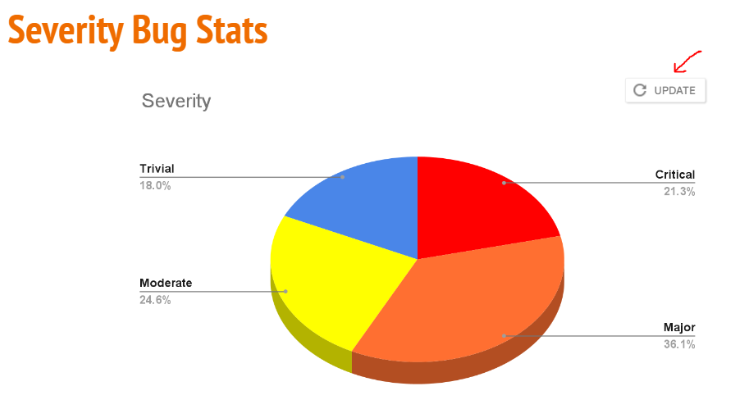
Another potential use could be to embed the charts directly into Google Slides and get updates through the button shown when the charts get “fresh” data from the script.
Potential Reuses
From a functional perspective, this work could be time-saving for PM and/or a Scrum Master, that can build their customized and up-to-date dashboard or nourish some slide template which is usually shown during the Agile ceremonies. From a technical point of view, the javascript code is quite easy to maintain and adapt, potentially with other clients, such as Excel 365, Figma, Invision, and Adobe. The limit of this tutorial is related mainly to the Personal Access token approach, which doesn’t allow to use of the same feature from other accounts: in agreement with the DevOps, it could be possible an Integration directly in the Gitlab CI to turn it as a company’s tool instead of an individual’s tool.

